google.com, pub-3034129604152953, DIRECT, f08c47fec0942fa0 Skip to main content

Choosing the Right Technical and Fundamental Analysis Tools for Successful Trading

Understanding Technical Analysis: Popular Tools and Strategies for Forex Trading


Technical and fundamental analysis are two widely used methods of analyzing the foreign exchange market. Both approaches have their own advantages and disadvantages, and traders should consider which method best suits their trading style and goals. In this article, we will discuss the right technical and fundamental analysis tools for forex trading, and how to use them to make informed trading decisions.

Technical Analysis Tools:

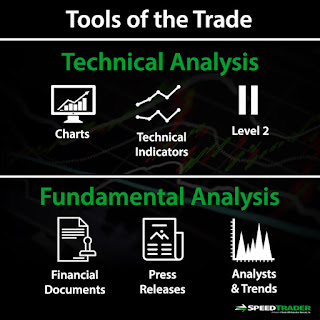
Technical analysis is the study of past market data, primarily price and volume, to identify patterns and make trading decisions. Technical analysis tools include charting software, indicators, and oscillators. Some of the most popular technical analysis tools include:


  • Moving averages: These are trend indicators that help traders identify the direction of the market.
  • Bollinger bands: These are volatility indicators that help traders identify overbought and oversold conditions.
  • Relative Strength Index (RSI): This is a momentum indicator that helps traders identify potential trend reversals.
  • Fibonacci retracement: This is a technical analysis tool that uses horizontal lines to indicate levels of support and resistance.


Fundamental Analysis Tools:

Fundamental analysis is the study of economic and political factors that can affect the value of a currency. Fundamental analysis tools include economic indicators and news releases. Some of the most important fundamental analysis tools include:

  • Gross domestic product (GDP): This is a measure of the economic activity in a country.
  • Interest rates: These are the rates at which banks lend money to each other, and they can have a significant impact on currency values.
  • Inflation: This is the rate at which the overall price level of goods and services is rising.
  • Political events: Political events such as elections and policy changes can also have a significant impact on currency values.

Using Technical and Fundamental Analysis Together:

Both technical and fundamental analysis have their own strengths and weaknesses, and many traders find that using both methods together can provide a more complete and accurate picture of the market. For example, a trader may use technical analysis to identify a potential trade, and then use fundamental analysis to confirm the trade.

Conclusion:

In conclusion, technical and fundamental analysis are two widely used methods of analyzing the foreign exchange market, both have their own advantages and disadvantages. Choosing the right technical and fundamental analysis tools depends on the trader's goals and style. By using both methods together, traders can gain a more complete and accurate picture of the market and make informed trading decisions. It's also important to regularly review the performance of these tools and make adjustments as needed.

Comments

Popular posts from this blog

Deposit and Withdrawal Options: Convenient and Efficient Access to Your Funds.

 Deposit and Withdrawal Options: Convenient and Efficient Access to Your Funds. When it comes to forex trading, choosing the right broker is essential. One important factor to consider when selecting a broker is the deposit and withdrawal options that they offer. It is important to choose a broker that offers convenient and efficient access to your funds, as this can have a significant impact on your trading experience. In this chapter, we will explore the various deposit and withdrawal options available and how to choose the best options for your needs. Deposit Options. Forex brokers offer a range of options for depositing funds into your trading account . Some of the most common options include. Credit/debit cards: Many brokers accept deposits by credit or debit card, which can be a convenient option for funding your account quickly. Bank wire transfer: Some brokers allow you to transfer funds from your bank account to your trading account using a wire transfer. This can be a good op

Spreads and Fees: Finding the Most Competitive Options.

What are Spreads and Fees? In the forex market , the spread is the difference between the bid and ask prices for a currency pair. When you place a trade, you will typically be required to pay the spread as a cost of the trade. For example, if the bid price for EUR/USD is 1.2050 and the ask price is 1.2055, the spread would be 5 pips (0.0005). In addition to spreads, brokers may also charge other fees such as commissions or financing charges. These fees can vary widely from one broker to another, so it is important to compare the costs of different brokers in order to find the most competitive options. How to Compare Spreads and Fees. There are a few key things to consider when comparing the spreads and fees of different brokers. First, consider the type of account that you will be trading with. Some brokers offer different spreads and fees for different account types, such as standard accounts, premium accounts, or VIP accounts. Next, consider the currency pairs that you will be tradin

แนวรับแนวต้าน (support and resistance) มีกี่ประเภท? และมีอะไรบ้าง?

ที่มาของคำว่า แนวรับ-แนวต้าน (support and resistance) ที่มีของมันก็ไม่ยาก หากเราเปิดกราฟดูภาพรวมแล้วล่ะก็ เราก็จะเป็นว่ากราฟจะเคลื่อนไหวไปในทิศทาง ขึ้น (Up) หรือ ลง (Down) หรือ ออกด้าน (Sideway) ดังนั้นเมื่อกราฟเด้งขึ้น หรือเด้งลง นักลงทุนหรือเทรดเดอร์ก็จะเรียกมันว่า แนวรับ - แนวต้าน (support and resistance) ซึ่งทางด้านการวิเคราะห์ปัจจัยพื้นฐาน แนวรับ- แนวต้าน (support and resistance) เหล่านี้ถือว่าเป็นพื้นฐานที่สำคัญมากๆในการนำมาวิเคราะห์ ช่วยให้นักลงทุนได้เข้าใจถึงกรอบราคาของตลาด หรือการวางแผนเข้า-ออกออเดอร์ การวางกำไรและขาดทุน นอกจากนี้ยังทำให้เราสามารถทำนายหรือมองภาพการเคลื่อนไหวในอนาคตได้อีกด้วย ประเภทของแนวรับ - แนวต้านที่สำคัญ (Types of Support and Resistance) 1. แบบดั้งเดิมคือ แบบ swing highs and lows เป็นแนวรับ - แนวต้าน แบบดั้งเดิมโดยดูที่ swing highs and lows ซึ่งสามารถมองหาได้จาก Time Frame ยาวๆ เช่น Week หรือ Monthly ด้วยการซูมกราฟให้มองเห็นภาพกว้างๆ จะทำให้เรามองเห็นภาพกรอบราคาด้านบนและด้านล่างได้อย่างง่ายดาย จากนั้นจึงทำการลากเส้น ใช้เส้นจาก TF Week เป็